Equity curve with drawdown overlay
The equity chart plots gross and net equity side by side, with underwater periods shaded on the data-viz panel. You can zoom into any drawdown event to see the individual trades that caused it.

Backtesting engine
Run a full backtest in under 90 seconds — with tick-level accuracy and a transparent assumptions log.
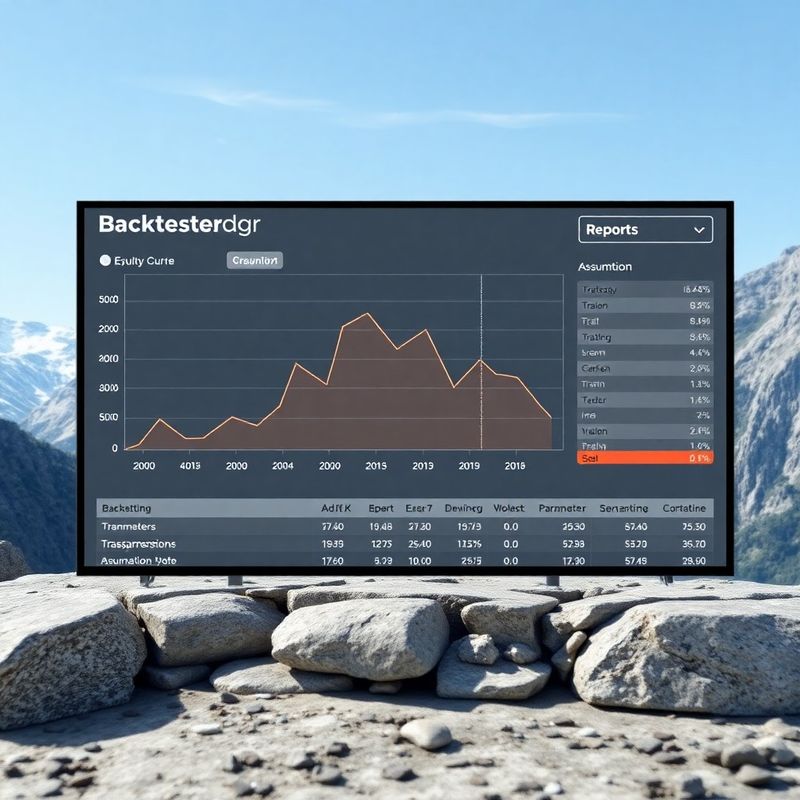
The backtesting engine replays your strategy rule set against historical tick data going back to January 2019 for all supported instruments. Every simulated trade is recorded with entry price, exit price, applied slippage (sourced from the same live spread model used in the demo account), commission estimate, and the rule version active at that moment. The output report covers net P&L, maximum drawdown, Sharpe ratio, Calmar ratio, win rate by instrument and by session, and a trade distribution chart. Crucially, the assumptions used — slippage model, commission schedule, data source — are listed at the top of every report so you know exactly what you are and are not looking at.
Not a single performance number, but a full breakdown of where the strategy earns and where it struggles.
The equity chart plots gross and net equity side by side, with underwater periods shaded on the data-viz panel. You can zoom into any drawdown event to see the individual trades that caused it.
Run a grid search across two parameters simultaneously — for example, fast EMA period versus stop distance — and see performance heat-mapped across 100+ combinations in a single pass.
Every report opens with a box stating the data source, the slippage model version, the commission rate applied, and the date range tested. No silent assumptions, no hidden optimism in the fill model.
Split your historical window into in-sample and out-of-sample segments. The walk-forward module runs optimisation on the in-sample period and validates on the held-out data automatically, in sequence.
Tick data is available from January 2019 for FX majors and EU equity index CFDs. For commodities, coverage starts from March 2020. We display the exact data range on the instrument selector so there are no surprises.
Yes. Slippage is modelled from a 90-day rolling average of live spreads, and commission is calculated at the rate corresponding to your plan tier. Both figures are shown in the assumptions log at the top of every report.
Every backtest report includes a CSV export of the complete trade-by-trade log: entry and exit timestamps, prices, applied slippage, commission, and the rule version ID that triggered each entry. The export is available immediately after the run completes.
On the demo account, you can run up to 20 backtests per day. The Standard plan allows 60 per day and the Pro plan is unlimited. Grid search and walk-forward runs count as a single backtest regardless of the number of combinations tested.
Strong backtest results are a necessary starting point, not a guarantee of live performance. Market microstructure, liquidity conditions, and the behaviour of other participants in 2024 differ from those in 2019 data. Survivorship bias, look-ahead bias, and overfitting are real risks in any historical test — which is why our walk-forward module and our transparent assumptions log exist. We document these limitations in the help centre and surface relevant warnings directly in the report UI when, for example, a parameter grid search produces suspiciously uniform results. A good backtest narrows uncertainty; it does not eliminate it.
Demo account access includes full backtesting — no plan upgrade needed to get started.
Open the backtesting engine